
Even though Bitcoin is leading the current rally, Ethereum has been on an even bigger run up as the cryptocurrency is up almost 20% in the past 24 hours alone breaking through the $250 level and now aiming for $300. With the rise in IEOs it’s only natural to see ETH increase in price similar to how the cryptocurrency exploded back in 2018 with the help of the ICO hype.
Essentially all cryptocurrencies are currently in a major bull rally, most seeing double digit percent gains. Last time Ethereum was at the $260 level was 9 months ago in August of 2018. Looking at past price action, the $290 level will be a slight resistance but nothing the bulls can’t overcome, especially with today’s market momentum.
Moreover, the current trade volume is higher than we have ever seen. At the time of writing, Ethereum is boasting a $14 billion 24 hour trade volume, compared to January 2018 where ETH hit its all time high of $1400 where the 24 hour trade volume peaked at $8 billion. That’s almost double the volume from the previous ATH! Not only does it mean that crypto has matured significantly the past year, but it also means that we may have a real chance at breaking through previous all time highs.
The steep increase in trade volume is also evidence if institutional money flowing into the space. After all, we have seen Bitfinex raise over $1 billion in 10 days via their IEO, something that would not have been possible a year ago. This influx of retail investors is a huge reason for the recent market action and can pave the way for a new paradigm in cryptocurrency.
Ethereum Price Technical Analysis
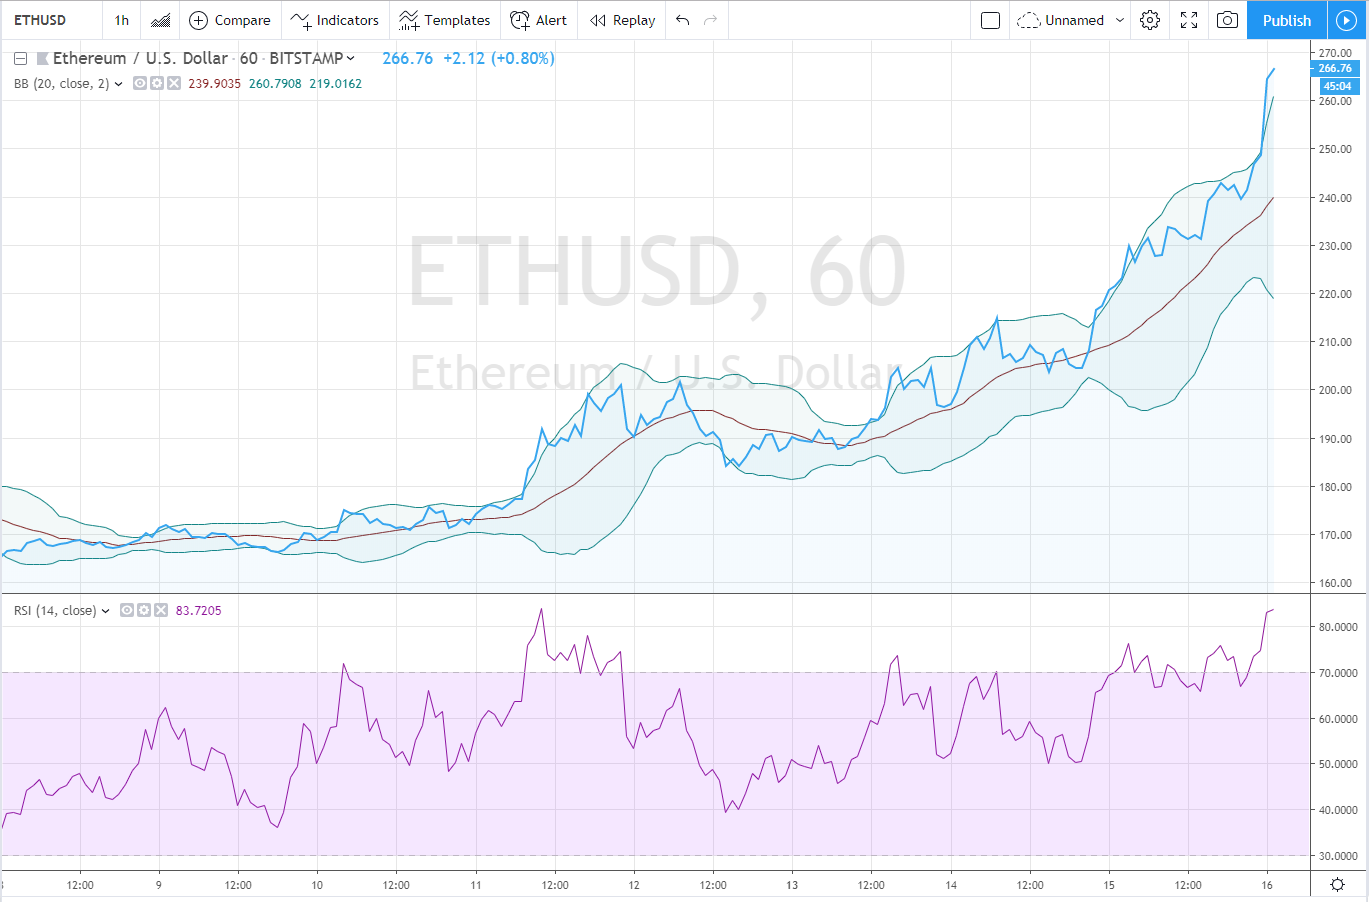
Relative Strength Index: At the time of writing the RSI for ETH/USD is at 82 points. That means that market is extremely overbought. However, as we can see from previous moments when the RSI crossed the safe market threshold, the current price action does not seem to be respecting this indicator. We may see Ethereum’s price run up stagnate a bit before resuming its normal course.
Bollinger Bands: So far we have seen Ethereum price not deviate too much outside the upper band. However, right now Ethereum’s price broke through the upper band which was at the $260 level. As such, we can expect a slight retracement back to $260 before any further price movements can be made.
Overall both indicators are pointing to the idea that Ethereum should retrace its steps a bit before continuing on its rally. However, with how the current market is going and with the insane amount of trading volume, Ethereum has a mind of its own that is paying no attention to technical indicators.
These market conditions are definitely exciting but it’s important to remind you not to succumb to FOMO which can land you in a whole world of trouble. It’s always best to buy an asset when the market is at the very least least stabilized, even if for a few hours, rather than rushing it to buy an asset that is increasing in value every second.
Ethereum’s next target is definitely the $290-$300 range, which at this rate should be reached within the next day or two. Moreover, as long as Bitcoin continues setting new 2019 all time highs we should expect the rest of the cryptocurrencies to follow.
Disclaimer: This is not trading or investment advice. The above article is for entertainment and education purposes only. Please do your own research before purchasing or investing into any cryptocurrency.