
Contents
Bitcoin Price Analysis (BTC/USD)
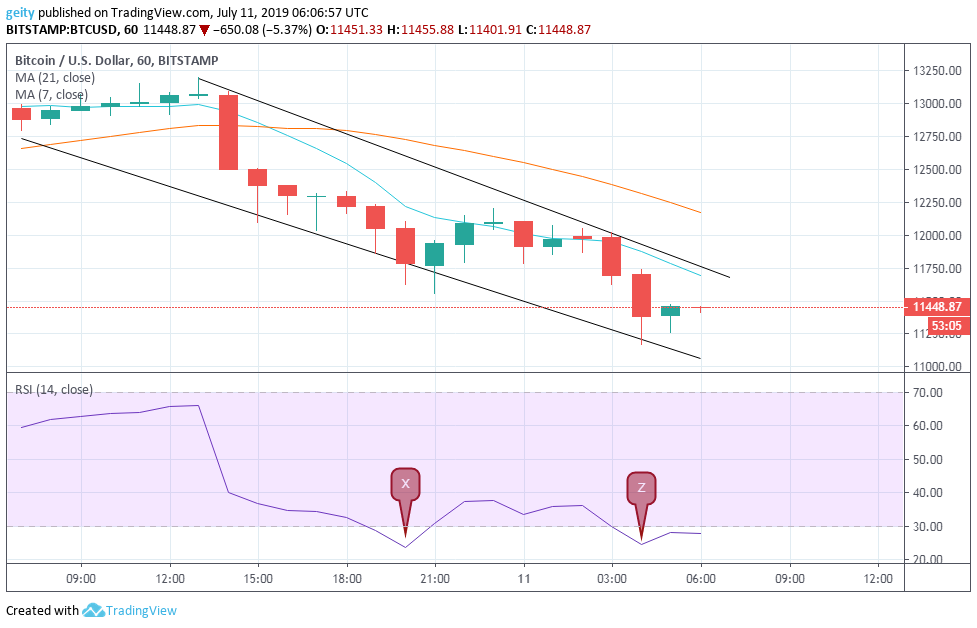
In the last 24hrs, BTC/USD pair exhibited a bearish outlook. BTC began the sell-off after a short-term period of consolidation that consolidated below $12864. The downtrend was supported by the 21 day MA that was seen gravitating above the 7 day MA that indicated a bearish sign. In addition, the descending channels also confirmed the bearish momentum.
The pair’s price sharply hit an intraday low at $11168.68 before it recovered to the current price at $11448.87. BTC has lost by 11.05% in the last 24hrs that showed growing bearish pressure. This placed the critical support level at $11686.21 and resistance level at $12119.37. The Relative Strength Index also reflected the bearish performance. It was seen trading below level 30 that indicated an oversold territory at X and Z.
Bitcoin Price Prediction
At the moment, the RSI indicator is trading flat that indicates a lack of momentum. Thus a short term period of consolidation is expected at $113980.00. However, the bearish rally is likely to be overcome if the bulls up their move. New targets should be set at $12000.00
Bitcoin Cash Price Analysis (BCH/USD)
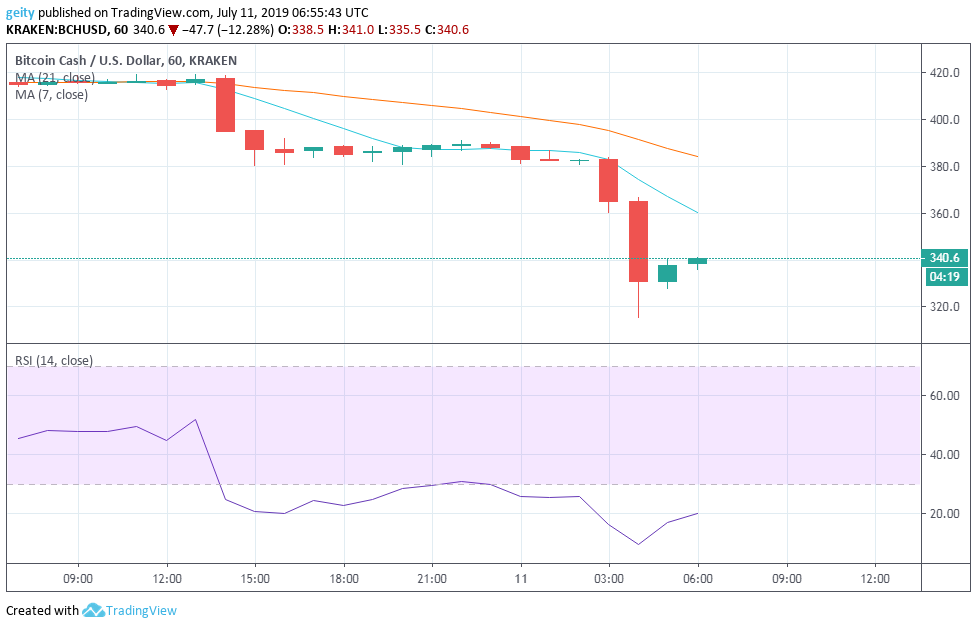
Like BTC, BCH has also been trading bearish over the last 24hrs. BCH is down by 17.9%, which is a significant fall, having begun the sell-off from $414.9 to the current rate at $340.6. The downward price momentum was bolstered by the 21 day MA that was seen gravitating above the 7 day MA.
The market saw a short-term period of consolidation below $414.0 that also acted as a support level. A price fall later followed that dipped the pair’s price down to consolidate below $380.0. At around 03:00, the price dipped further to a low of $315.0 before it recovered up to the current price.
The bearish movement was also reflected by the RSI indicator the was seen most of the time trading below level 30 that indicated an oversold market condition. This showed increase sellouts; the RSI is also heading Northway showing the reluctance of investors to go short in anticipation for better prices.
Bitcoin Cash Price Prediction
Bullish momentum is likely to be encountered. This is because the RSI indicator is currently heading north, which indicates a bullish sign. New targets should be set at $380.0.
EOS Price Analysis (EOS/USD)
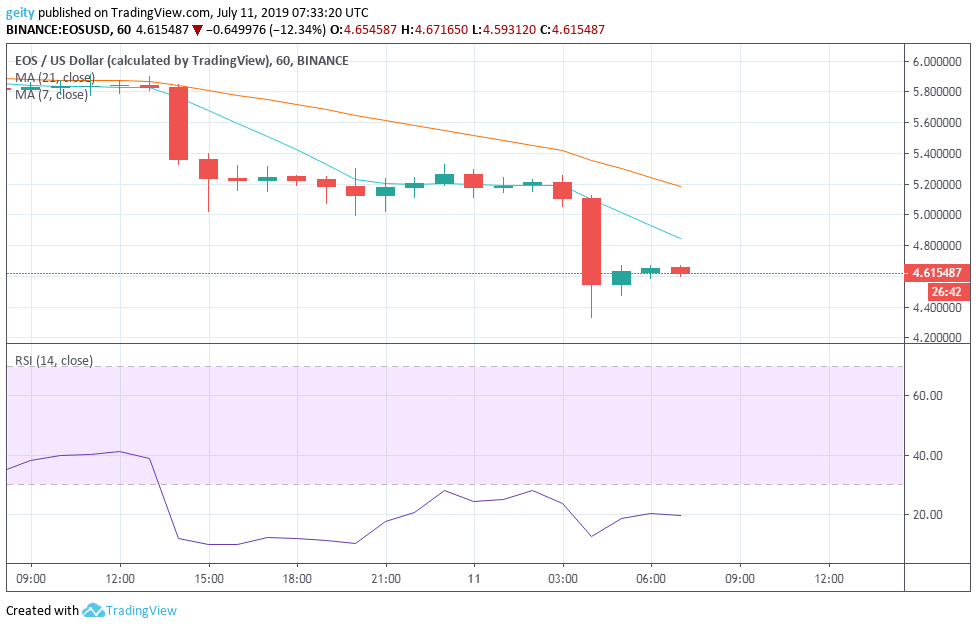
EOS/USD pair also underwent a bearish outlook in the last 24hrs. EOS has sway down by 20.8%, having moved from $5.8286 to $4.6155. The bearish rally was signaled by the 21 day MA that traded above the 7 day MA.
EOS saw a short-term consolidation period that dipped from $5.8027 to $5.087 that confirmed increase bearish pressure. Apparently, the market has been dominated by bears who seemed to be driving the coin further lower
The RSI indicator was continuously seen trading below level 30 that indicated that the market was on the oversold territory most of the time in the last 24hrs. This showed an increase in sellouts due to reducing confidence in the coin.
EOS Price Prediction
Despite a generally bearish outlook, a bullish sign is seen as indicated by the RSI indicator that is currently trading Northway. New target should be set at $5.0000.
Cryptocurrency Charts By Tradingview
Disclaimer: This is not trading or investment advice. The above article is for entertainment and education purposes only. Please do your own research before purchasing or investing into any cryptocurrency or digital currency.


