
Bitcoin’s price continues to rise blasting past the anticipated $6300 resistance level currently trading at $7156 on Bitstamp setting another all time high for 2019. At the time of writing the price is incredibly parabolic and some traders expect a drop to $6000 in the near future. Moreover, the cryptocurrency’s overall marketcap peaked earlier today at $221 billion setting a 9 month all time high.
The two biggest questions right now are: What’s causing Bitcoin’s insane rally, and how high will Bitcoin go? There are a few theories as to what’s causing Bitcoin’s rally. The first one is that the current bullish momentum is caused by natural market cycles which alternate between bearish and bullish. After having a one year long bearish market, many technical indicators pointed towards a trend reversal. The crypto market luckily honored those indicators and entered into a bullish market.
When it comes to Bitcoin’s next target, InvestingScope from tradingview believes that BTC will hit as high as $9,000 – $9,500. If that happens, there is no doubt that Bitcoin will attempt to test the $10,000 level as crypto loves round numbers.
With all the current hype about Bitcoin’s price there is also an increased interest in cryptocurrency overall. We can see evidence of that via an increase in live users on crypto related subreddits, increased in chat activity across exchanges and social trading platforms like tradingview. If you are just now starting to pay attention to Bitcoin then you are here most likely for the wrong reasons and will be extremely disappointed when the bull run will inevitable end.
If you are paying more attention to #bitcoin now than you were five months ago, you're probably here for the wrong reasons. Bitcoin isn't for you. Go back to day trading stocks. Thanks! 🍻
— A v B (@ArminVanBitcoin) May 11, 2019
The reason for the above statement isn’t to exclude users from entering the crypto space, but to emphasize the importance of understanding Bitcoin’s true value regardless of its price.
Bitcoin Price Technical Prediction
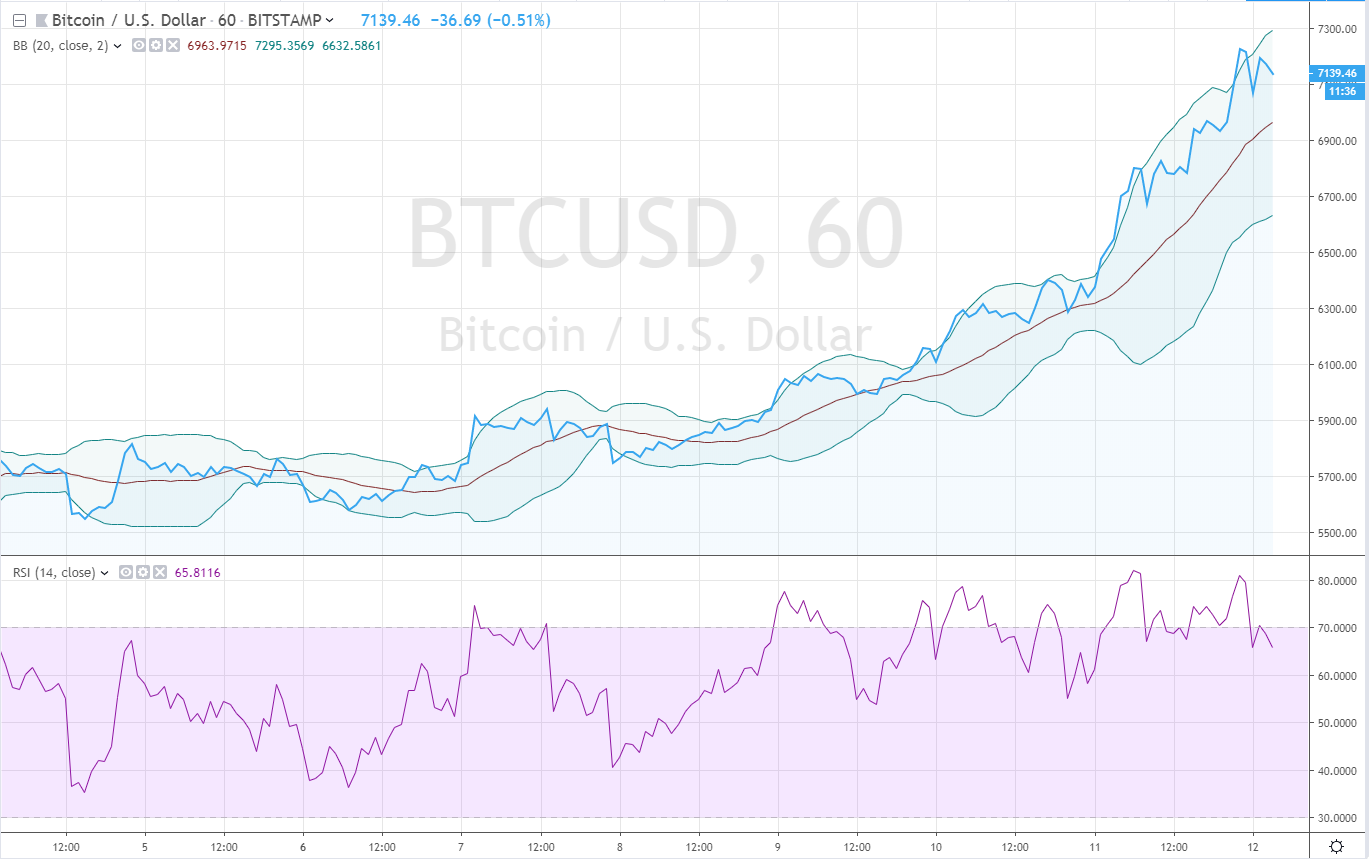
Relative Stength Index: Looking at the RSI, the market is definitely in the overbought level. However, at this point in time it seems that the RSI is irrelevant as Bitcoin has a mind of its own. We can see that the RSI has been constantly in the overbought levels suggesting downwards momentum, but the market continued its bullish run up regardless.
Bollinger Bands: Looking at the Bollinger Bands, we can see that the price retraced slightly after crossing the upper band. According to BB we still have some room for upwards momentum.
At this point, even though the RSI is indicating a retracement in the near future, the market hasn’t been honoring that indicator. Moreover, Bollinger Bands indicate that there is still room for further price gains. As such, bitcoin testing $7,300 in the next few hours is not out of the question.
Disclaimer: This is not trading or investment advice. The above article is for entertainment and education purposes only. Please do your own research before purchasing or investing into any cryptocurrency.


