
The resistance levels of 4050-4100 on BTCUSD seem to hold as it is currently trading sideways. For the last few hours, the 7 day MA and the 21 day MA seem to be intertwined and this can only imply that the currency is currently consolidating.
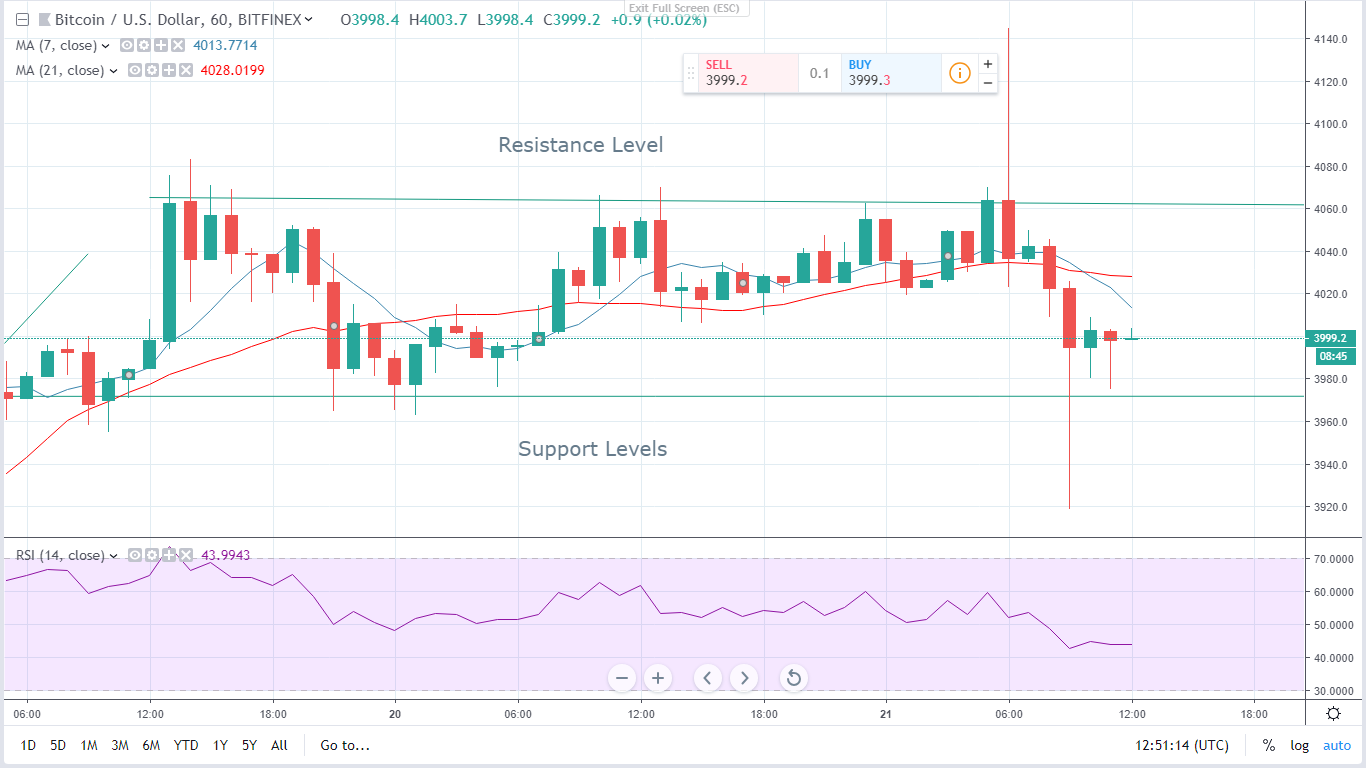
There hasn’t been any major change in the last 24 hours and the currency has been oscillating within the 3970 to 4100 range, finding support at 3960 and resistance at 4050. However, the bulls briefly managed to take it to a new high of 4150 before the bears pulled it back in a bearish engulfing that brought the piece to a low of 3918. Currently, the bulls seem to find temporary resistance at 4000 but support seems to be at 3970.
Looking at the RSI, the last few hours demonstrate a market that is struggling to maintain bullish momentum. Currently, the RSI is hovering close to 40 from a high of 60. This demonstrates that the current market is bound to trade sideways with a bias towards the bears pulling the price down.
Bitcoin Price Forecast
The first scenario: In the short term, buyers are expected to find temporary resistance at the 4000 level but gain solid support at 3960. If the 4000 mark is breached we should expect a northward rally that should drive the price further up and put our new resistance levels at 4100. New support levels will be at 4000.
In the second scenario, the bulls may experience temporary resistance at 4000 and the bears pull the price to lower levels but experience support at 3960. At the moment, the 21 day MA has crossed over the 7 day MA. This may signal that the price of the currency is definitely finding resistance at 4000 and may have to pull back before a bullish reversal occurs.
In both these scenarios, an intra-range would be ideal with support placed at 3960 and resistance at 4050- 4100.Traders can go long once the price bounces back from the support levels(3960-3970) and take a short position if the price pulls back from resistance levels(4050-4100)
Disclaimer: This is not trading or investment advice. The above article is for entertainment and education purposes only. Please do your own research before purchasing or investing into any cryptocurrency.
Image(s): Shutterstock.com


