
Contents
Bitcoin Price Analysis (BTC/USD)
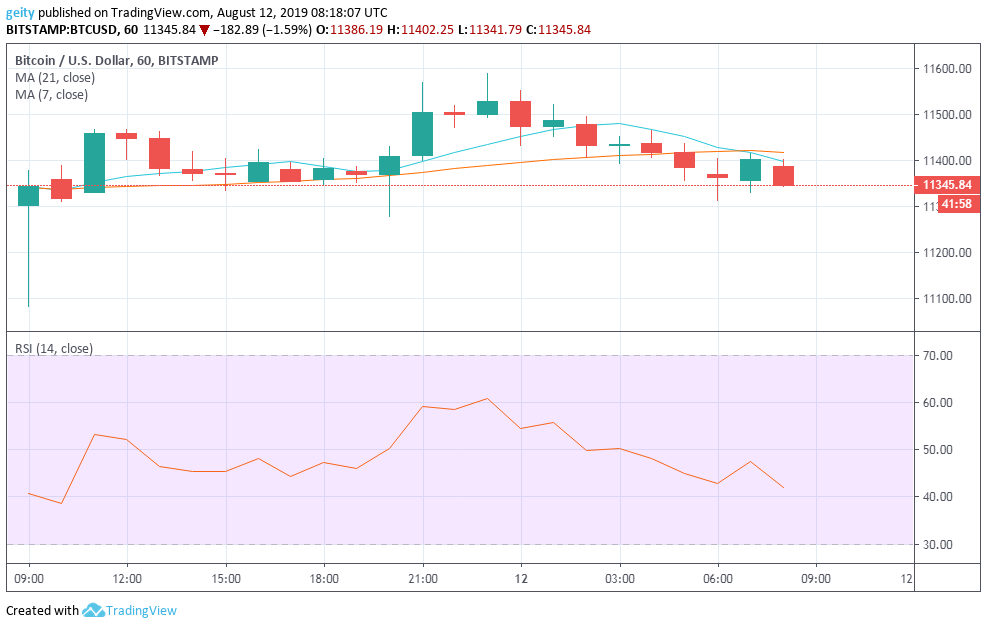
After a sharp dip that took place back on 10 of August at 11:00, the market seemed to have taken a pause to consolidate on an intraday price chart. Hourly resistance level $11536.91 continues with support level defined at $11341.29. Notably, both the significant level was tested in several instances.
Additionally, the intertwined moving averages confirmed the lack of dominance in the market momentum. The RSI indicator was seen declining Northway that signaled an increase in bearish outlook that also reflected an increase in sell-offs. Despite the bearish pressure, the market of BTC has slightly gained by 0.02% having moved from $11344.06 to $11345.84.
The downward movement has brought the market capitalization of BTC to the tune of $203,080,523,766 over the last 24hrs. According to analyst until Bitcoin’s halving the price of BTC could be on a tight range between the resistance level $11536.00 and the support level $9000.0.
Bitcoin Price Prediction (BTC/USD)
Currently, all the technical indicators point at the further downtrend, the 21 day MA has crossed the 7 day MA, and the RSI indicator is heading north. Traders should go short if the price breaches $11341.29. However, if the bull manages to break $11536.91, then traders should go long and take profit at $12000.0.
Ripple’s XRP Price Analysis (XRP/USD)
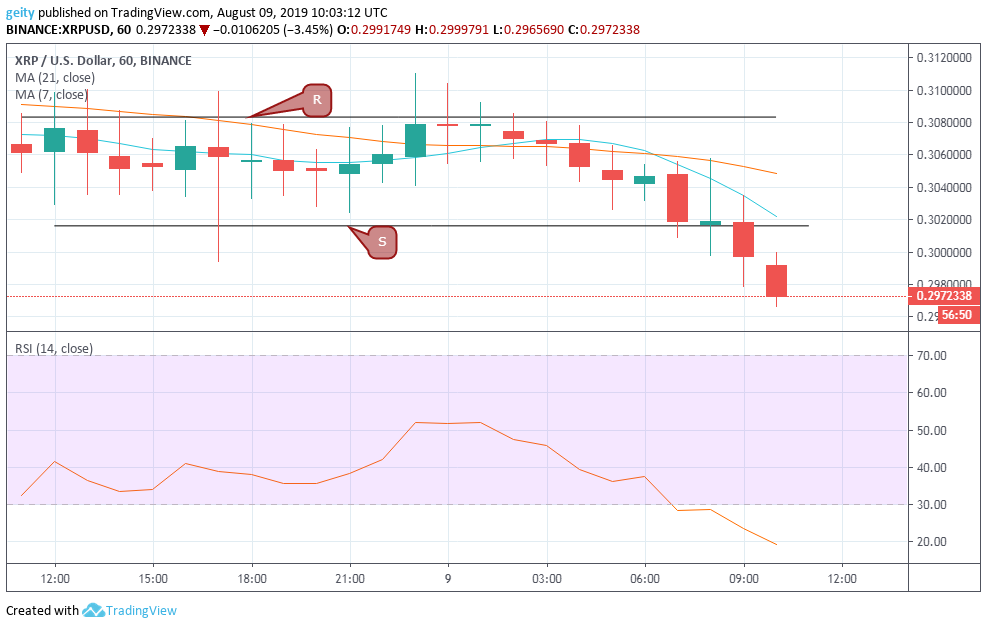
The third ranked cryptocurrency started the session trading at $0.29786 and is currently trading at $0.29925. This translates to a minimal gain of 0.46% over the last 24hrs. Despite the slight gain, the market exhibited a bearish rally that was reflected by the 21 day MA that crossed above the 7 day MA.
The trend is sideways as the horizontal channels have confirmed it. The channels also acted as the price support $0.29812 and resistance $0.30528 level. In the market, the price steeply dropped as reflected by the RSI indicator that dipped from a high of 68 to a low of 43 that signaled a bearish momentum. The market is currently lacking momentum since the RSI indicator is hovering between level 40 and 60.
Ripple’s XRP Price Prediction (XRP/USD)
The 21 day MA is currently above the 7 day MA. This signaled an increase in bearish momentum. If the price manages to break the support level $0.29812, then investors can go short. New targets should be set at $0.30000.0
Bitcoin Cash Price Analysis (BCH/USD)
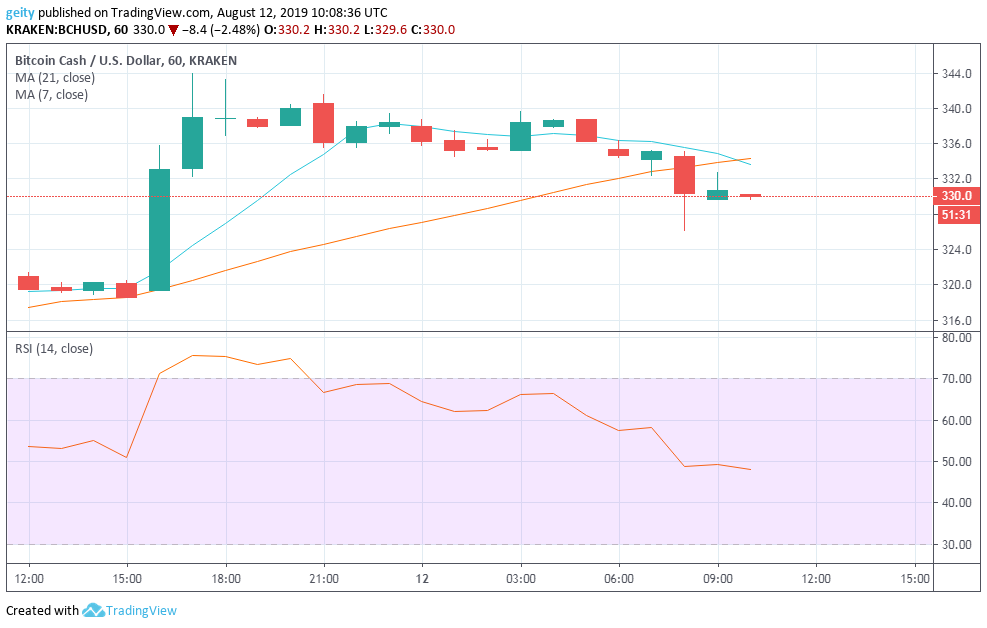
Over the last 24hrs, BCH/USD pair seemed to have gained momentum since it is currently changing hands above $330.0. The famous cryptocurrency is up by 3.2% throughout the intraday. The bullish outlook was however supported by the 7 day MA that gravitated above the 21 day MA during the last 23hrs.
Investor’s sentiments rose slightly before embarking to a steady flow. The RSI indicator that moved from the overbought market zone (above level 70) to a low of 48 reflected this. Additionally, an immediate resistance level was seen at $340.6 and support level at $334.8 that was later breached.
A sharp rise above the $350 level may be encountered if the price breaks the $340.0 level. The RSI indicator is currently between level 40 and 60 that indicate indecision in the market momentum.
Bitcoin Cash Price Prediction (BCH/USD)
At the moment, the 21 day MA has crossed above the 7 day MA that indicates incoming bearish run. New targets should be set at $320.0.
Cryptocurrency Charts By Tradingview
Disclaimer: This is not trading or investment advice. The above article is for entertainment and education purposes only. Please do your own research before purchasing or investing into any cryptocurrency or digital currency.


