
Contents
Bitcoin Price Analysis (BTC/USD)
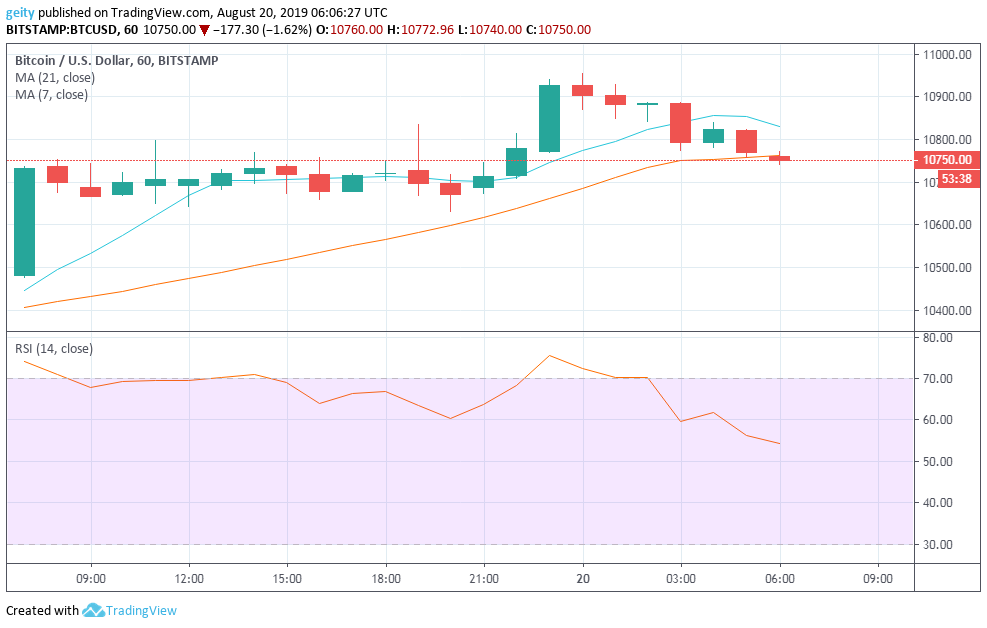
On an hourly chart, the bulls have dominated the market of BTC/USD pair. The 7 day MA was seen gravitating above the 21 day MA that signaled an increase in bullish pressure. The top cryptocurrency has slightly gained by 0.17%, having escalated from $10731.71 to $10750.00.
Apparently, a bullish engulfing candle started the session that shifted the price up to a high of $10737.38. A medium-term period of consolidation also followed between $10671.09 and $10741.42 level. The pair’s price later fluctuated upwards before a decline down to the current price of $10750.00.
The RSI indicator that moved from the overbought zone as at 23:00 to a low of 54 that signaled an increase in sellouts also reflected the dip. Notably, the bulls have currently lost the market dominance to the bears due to a decrease in investor’s sentiments.
Bitcoin Price Prediction (BTC/USD)
The 7 day MA is still above the 21 day MA that signal a further uptrend, a break near $11000.00 is likely. However, a breakout below $10600.00 might be a turnaround for the bulls since it may result to a down side price rally.
Tron Price Analysis (TRX/USD)
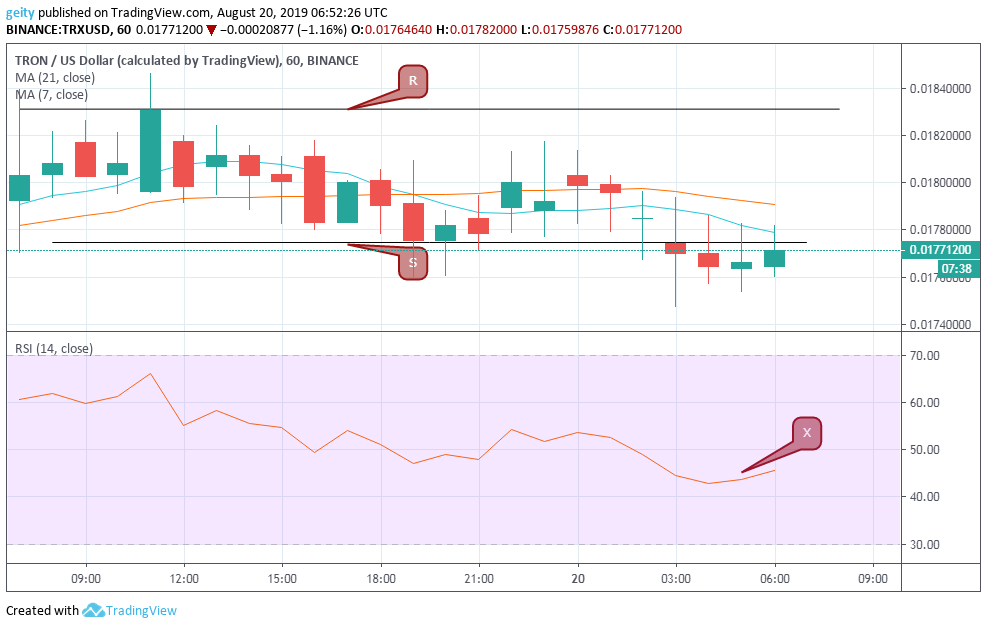
Unlike BTC, the overall performance of TRX/USD is bearish over the intraday. The bearish outlook had gained support from the 21 day MA that is now above the 7 day MA. A struggle to break the $0.01775 support level was seen with no attempt to break the significant resistance level that was at $0.01831.
Additionally, a strong bearish trend line was formed due to an increase in selling pressure that came from bears. The RSI indicator declined from above level 60 to below level 50 that signaled a reduce confidence in TRX coin by the investors thus, increase in sell-offs.
Tron Price Prediction (TRX/USD)
On the expert’s point of view, the most crucial support is likely to be seen near $0.0100. To relate to that, the 21 day MA is still actively hovering on top of the 7 day MA. This shows that the support zone is going to keep dropping lower and lower, which is a secure bearish sign. New targets should be set at $0.0150.
Litecoin Price Analysis (LTC/USD)
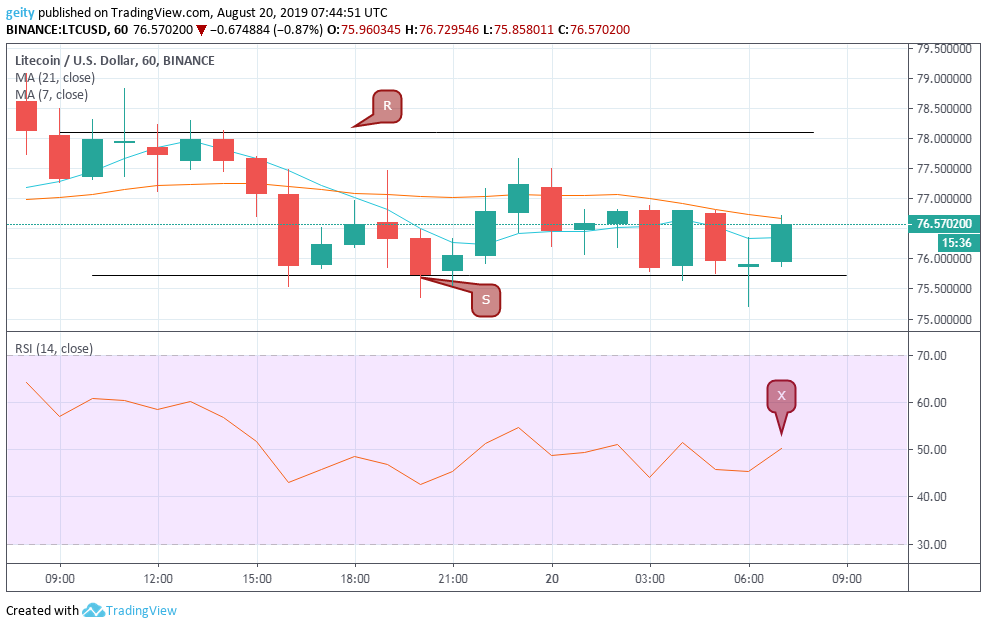
The 5th ranked cryptocurrency has also exhibited an overall bearish outlook in the last 24hrs. LTC/USD pair started the sell-off trading at $78.1421, followed by a short-term intraday period of consolidation between the significant resistance level $78.1203 and critical support at $77.3215.
The pair’s price later corrected losses to dip further down to trade horizontally below a critical support at $75.7239. The pair’s price managed to maintain its value near $76.5702. The excessively bearish move from $78.1421 to $76.5702 has total up to 2.0% decrease over the last 24hrs.
The RSI indicator X is currently heading north that signal a bullish sign that also showed that investors are anticipating at better prices.
Litecoin Price Prediction (LTC/USD)
Currently, the 21 day MA is above the 7 day MA that indicates further bearish outlook. A break below $75.7239 could confirm a downward move. However, if the bulls up their move and break past $77.3215 level, the new target should be expected near $81.00 level.
Cryptocurrency Charts By Tradingview
Disclaimer: This is not trading or investment advice. The above article is for entertainment and education purposes only. Please do your own research before purchasing or investing into any cryptocurrency or digital currency.


