 – LTC Extends Bearish After Cracking Crucial Support, No Sign of Recovery Yet")
Litecoin continues to roll down after finding it difficult to extend bullish in February. The recent crackdown has confirmed more bearish play for the 13th best-performing crypto by market cap.
The rate at which altcoins are bleeding out has been somewhat worrisome over the past month. Litecoin is not left behind in the scenario, as it has depreciated by 12% in the past week.
However, the $105 resistance level seemed to have become a benchmark for the bulls – they need a strong reinforcement to break through that area in the next leg up. But for now, things are not looking good for them. They have lost control in the hands of the bears.
Last week, LTC attempted to resume bullish with a double-bottom following a slight rebound at the crucial $90 support level. But unfortunately for the bulls, the support quickly turned resistance after a sharp nosedive on Monday. The crackdown led to a serious panic selling as spot traders exit their positions.
It has continued to lose momentum today as sellers add to their positions on futures. Although there’s hope for recovery if it can find support above $60.
Technically, Litecoin is extremely oversold on the lower timeframe with no sign of retracement yet. A fall below yesterday’s support – which has been the lowest price since it started to fall in February – should signal a continuation of the trend.
Fundamentally, the coin is expected to resume its mid-term bullish trend soon, except if it experiences negative news or announcements in the future. The general perspective and sentiment of the market remain bearish for now.
Litecoin’s Key Price Level To Watch
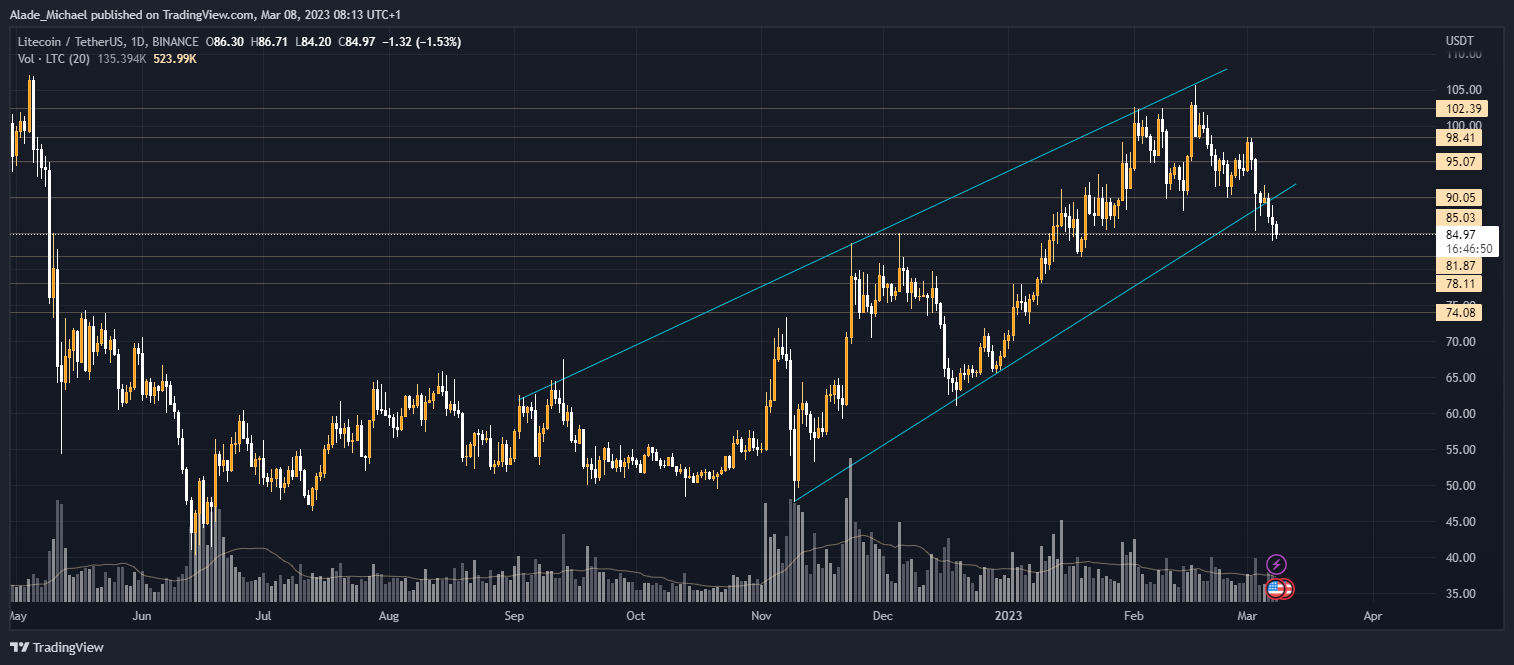
Source: Tradingview
Having said all that, the area of interest for the bears now lies at $81.87 after dropping off yesterday’s low of $84. Further support levels are located at $78.1 and $74 in case of more decline.
In the next leg up, it would first need to reclaim Monday’s breakdown level mentioned earlier. The resistance levels above it are $95, $98.4 and $102.4 before rising to the previous benchmark resistance.
Key Resistance Levels: $90, $95, $98.4
Key Support Levels: $81.87, $78.1, $74
- Spot Price: $84.7
- Trend: Bearish
- Volatility: High
Disclosure: This is not trading or investment advice. Always do your research before buying any cryptocurrency or investing in any services.
Image Source: andreystv126/123RF // Image Effects by Colorcinch


