 – XRP Turns Weak Amid Latest Altcoins Recovery, Signals a Sell")
Against Bitcoin, XRP currently appears weak on the daily chart as it shed a 5% loss in the last 24 hours. It signals bearish, but there’s no strong conviction for a sell yet as it currently gathers momentum.
Several attempts to resume bullish has proven abortive in the past month with multiple rejections under the new high of $3.4. It created resistance levels and formed a lower highs pattern.
However, the price is still within a buy zone on the daily chart but is likely to print a big loss anytime soon following a bearish build-up on the weekly chart. When this will happen is yet unknown, still, we can expect a major crash as soon as the price drops off the critical $2 level.
This critical level is considered short-term support. Failure to break it could raise the bulls’ hope for another rally to a new all-time high. But from the look of things, the bears will likely have the upper hand as the demand level appears low on the daily scale.
In disguise, it is slowly gathering momentum for a drop from a technical perspective. A significant increase in the supply level should cause a big disruption in the market before regaining momentum. In anticipation, $1 remains a key target level for a rebound
XRP’s Key Level To Watch
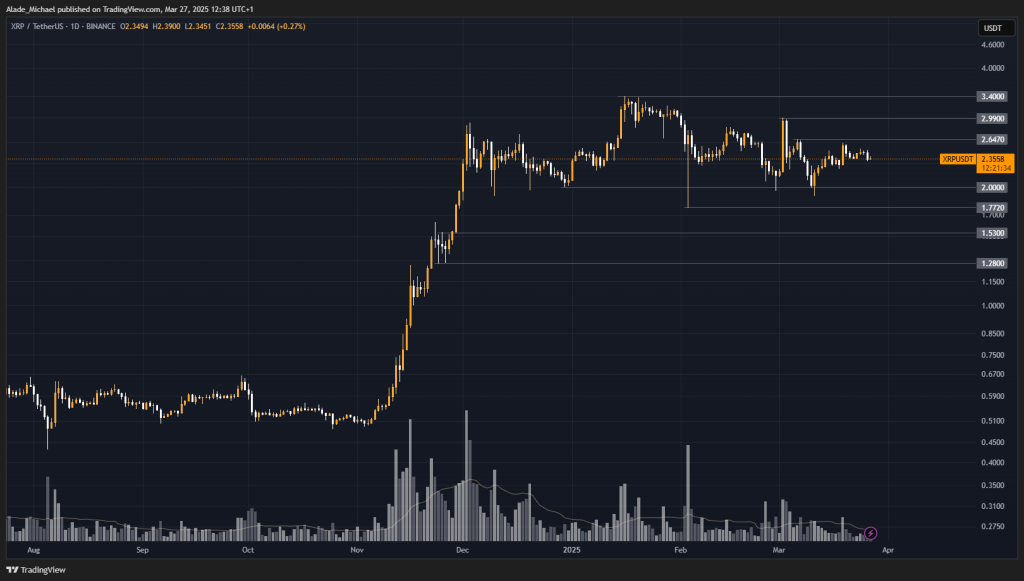
Source: Tradingview
Now that the crypto is back on a sell mode, it may revisit the critical $2 support. Breaking it could plunge the price to the $1.77 support and $1.53 before retracing.
Towards the upside, there’s an immediate resistance at $2.64. If the price increases above it, higher resistance levels to watch for a rally would be $2.99 and $3.4 in the near term.
Key Resistance Levels: $2.64, $2.99, $3.4
Key Support Levels: $2, $1.77, $1.53
- Spot Price: $2.35
- Trend: Bearish
- Volatility: Low
Disclosure: This is not trading or investment advice. Always do your research before buying any cryptocurrency or investing in any services.
Follow us on Twitter @nulltxnews to stay updated with the latest Crypto, NFT, AI, Cybersecurity, Distributed Computing, and Metaverse news!
 – XLM Advances Bullishly Despite Slight Pause in Buying, Adds Another 30% Daily Gain")
 – Ski Explodes Massively Amid Fresh Market Increase, Leads Top Base Meme Coins Chart")
 – Pengu Resumes Bullish After a Short Pullback, Jumps 30% Daily")