
Contents
Bitcoin Price Analysis (BTC/USD)
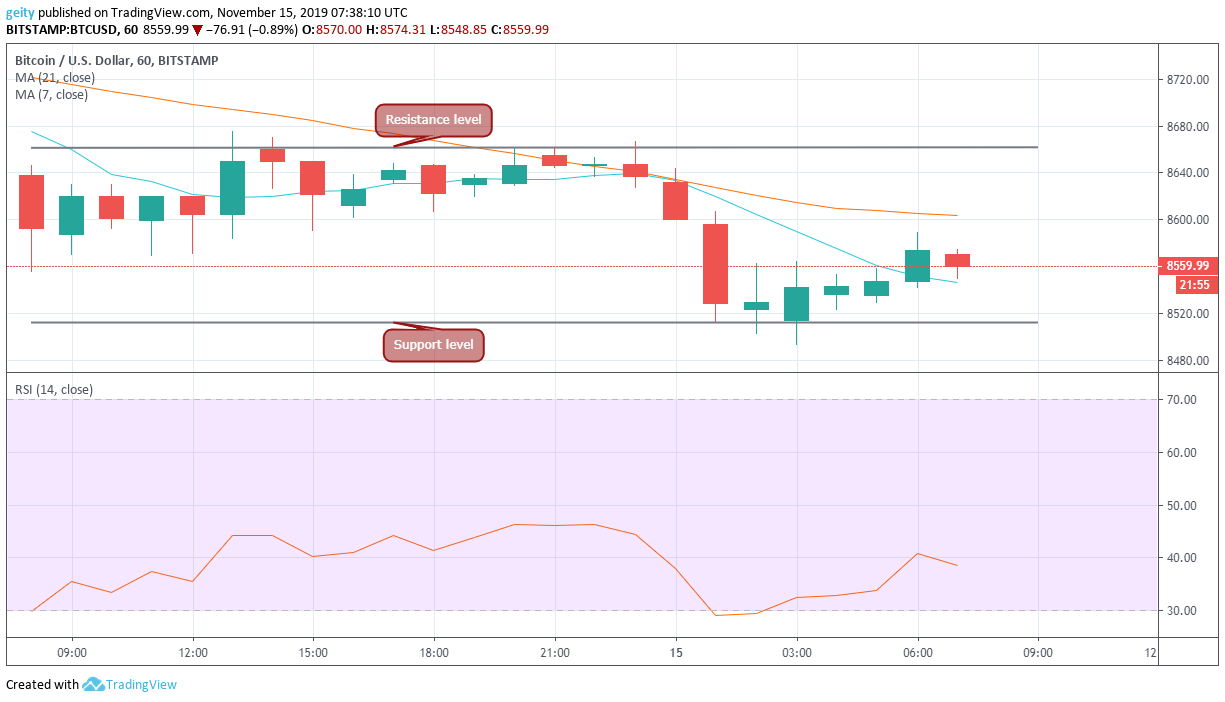
BTC/USD pair has been on a downtrend over the last 24hrs. The coin has also given significant moves that suggested intense bearish pressure coming from sellers. The top cryptocurrency is thereby down by 0.37% after having shifted from the opening session of $85.92.24 to the closing price at $8550.99. Besides, the downside action of BTC/USD pair could perhaps result in a significant dip in other altcoins. Thereby, more buyers are needed to restore the bullish momentum.
Additionally, the market began by consolidating above $8601.10 support level, with the key resistance level being at $8659.37. Moreover, the price broke below $8601.10 level to move further into a bearish zone, thus, defining the next support near $8511.97. At the moment, both moving averages are giving a bearish outlook, and the RSI is below average, thus indicating that the bearish action is at the peak.
Bitcoin Price Prediction (BTC/USD)
Currently, the pair’s price is gaining some momentum; therefore, an upside break above $8659.37 resistance level could accelerate higher towards $9000.00. However, if the downside move continues, then the price may breach $8511.97 level and correct lower below $7000.00 level.
Litecoin Price Analysis (LTC/USD)
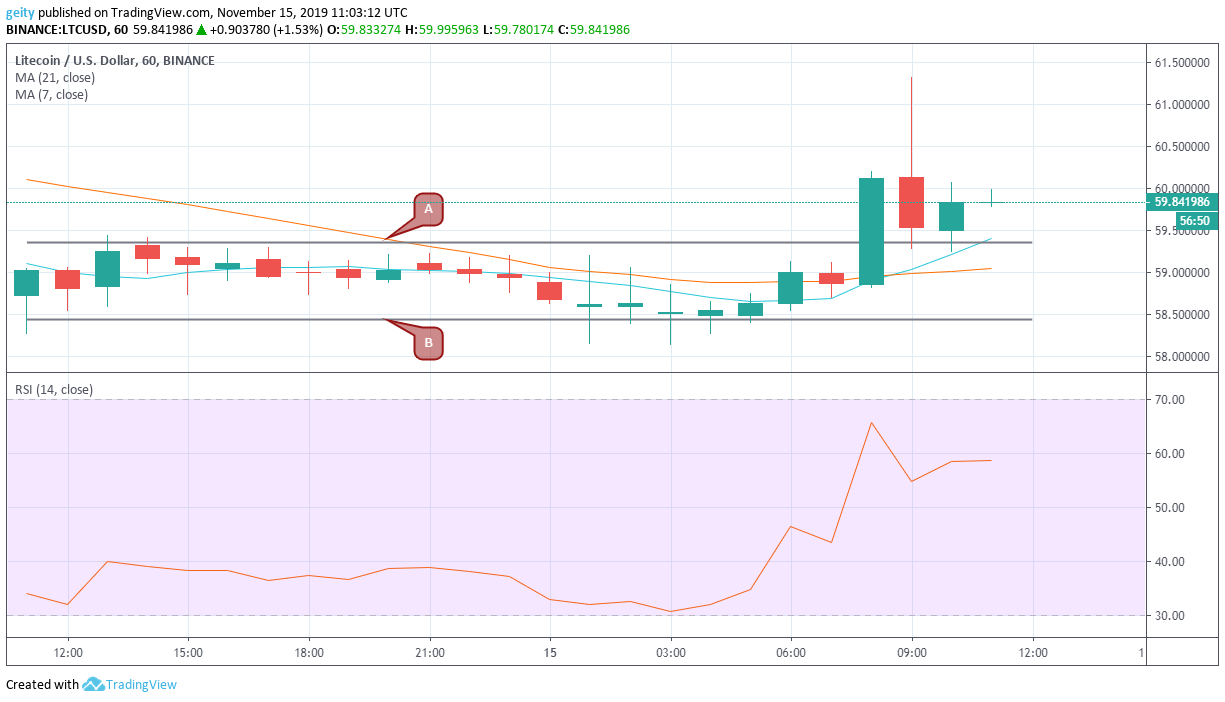
LTC/USD pair is at the moment registering a bullish performance, and the popular altcoin is up by 1.35% over the past 24hrs. However, before the bullish breakout above the upper horizontal channel (A), that also acts as the resistance level $59.37. The market undergone through consolidation phase between $59.37 and $58.46 level, respectively. Additionally, the price jumped from $59.03 to now changing hands at $59.84, suggesting high demand in buying.
The sideways movement showed that the market was facing unsustainability. Perhaps due to lack of dominance from either buyers or sellers. Afterward, the bullish action was later bolstered by both moving averages that poised to a positive crossover. The RSI that recovered above the average level that signaled a positive sign.
Litecoin Price Prediction (LTC/USD)
If the bulls retain the momentum and keep the price above $59.37 level, then further upside towards $65.00 is likely. On the downside, if the price moves back into the horizontal channels exhibited and traded lower below $58.46, then more losses are likely to dip the price near $52.00.
Cryptocurrency Charts By Tradingview
Disclaimer: This is not trading or investment advice. The above article is for entertainment and education purposes only. Please do your own research before purchasing or investing into any cryptocurrency or digital currency.


