
Contents
Bitcoin Cash Price Analysis (BCH/USD)
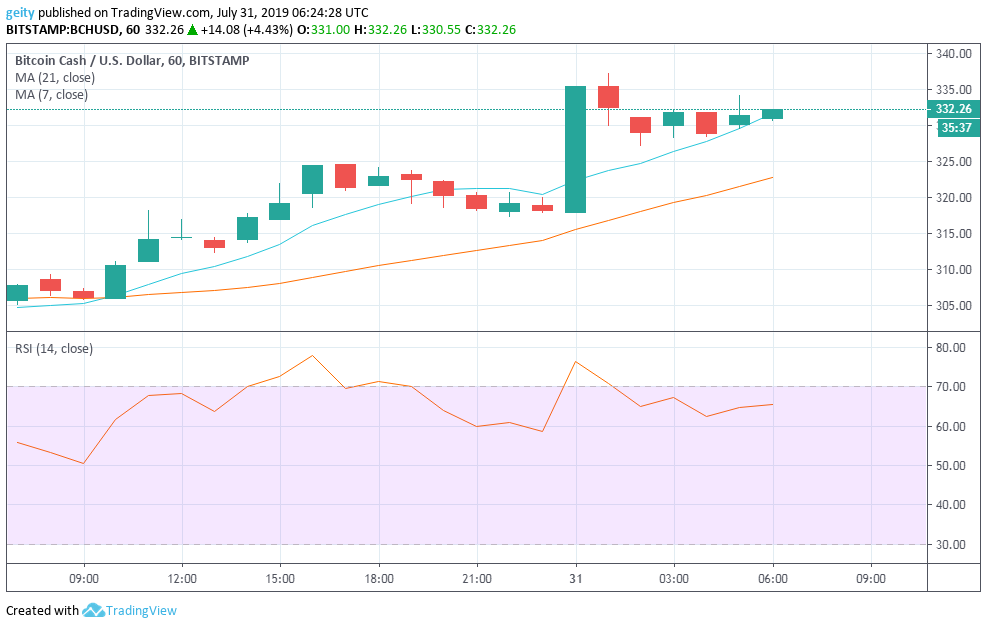
On an hourly chart, BCH/USD pair has impressively performed. It seemed like the recent Bull Run of BTC has positively affected the price of many cryptocurrencies, BCH included. BCH has been on a Bull Run that was supported by the 7day MA that gravitated throughout the intraday above the 21day MA, which signalled a bullish pressure. It is up by 9.19%, having moved from $307.70 to the current price of $332.26.
The support level has been recovered and upended from $317.76 level to $328.76 level that confirmed the uptrend. The uptrend later defined a major resistance level at $335.73. The Relative Strength Index indicator was also seen above level 50 that indicated an increase in buyouts. At 16:00 and at 0000hr the RSI indicator was seen above level 70 that showed that the market was on an overbought market territory.
The RSI indicator reflected an increase in investor’s sentiments; thus, the bull dominates the market momentum.
Bitcoin Cash Price Prediction
At press time, all the indicators foresee further Bull Run. The 7 day MA is actively trading above the 21 day MA. The RSI indicator is tending Northway that signals a further uptrend. Investors should go long as soon as the price breaks the resistance level $335.73 and take profit at $350.00.
Monero Price Analysis (XMR/USD)
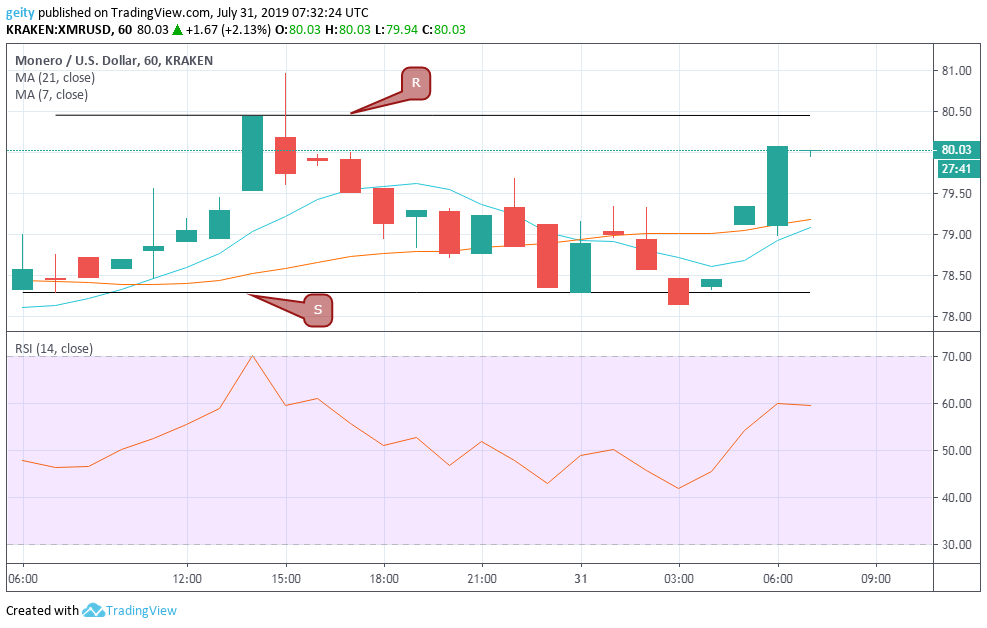
Like BCH, XMR/USD pair has also undergone a bullish outlook over the last 24hrs. Despite the bullish rally, the price momentum is on a sideways trend that was confirmed by the horizontal channels. The channels also acted as the price support level $78.30 and resistance level $80.45.
However, XMR has upsurged by 1.8%, having opened the session at $78.58, where it surged up to the current price at $80.03. The intertwined moving averages signaled a lack of momentum in the market. At around 14:00, the RSI indicator almost crossed the overbought territory that indicated an increase in bullish pressure.
The price rally later on fluctuated down massively before gaining momentum where it corrected up to the current price of $80.03. Additionally, the RSI is at the moment trading flat, which signals a lack of dominance from either the buyers or the sellers.
Monero Price Prediction
Currently, the 21day MA is above the 7 day MA that indicates incoming bearish market rally. However, if the price breaches the resistance level $80.45, then traders should consider going long and take profit at $81.50.
Litecoin Price Analysis (LTC/USD)
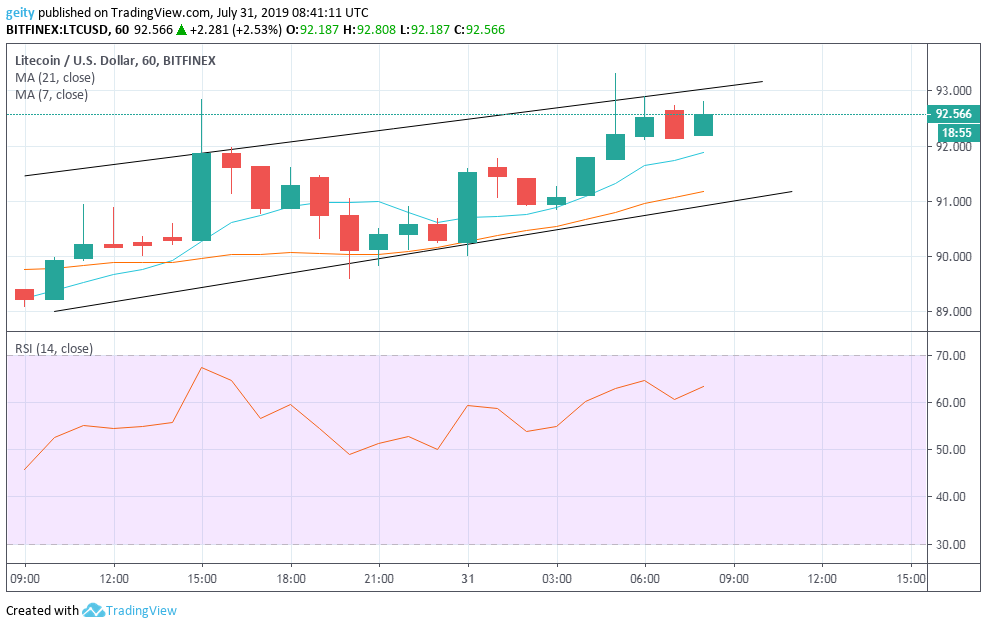
LTC/USD has also recorded a bullish market rally over the past 24hrs. Presence of ascending channels confirmed the uptrend. The 7 day MA supported the uptrend since it was seen hovering above the 21 day MA throughout the intraday that signaled a bullish trend.
The pair’s price gained by 3.5%, having started the session trading at $89.218 where it later upsurged to the current price of $92.566. The RSI indicator was also seen heading north, which signaled an increase in buyouts; thus; the bulls had the upper hand throughout the intraday. The RSI indicator also shows reluctance of investors to go short in anticipation for much better prices.
Litecoin Price Prediction
All the indicators point at a further bullish rally, with the 7 day MA gravitating above the 21 day MA and the RSI currently heading towards north. This signals more Bull Run in the coming day. Nevertheless, if the pair’s price breaches the upper channel, then investors should go long and take profit at $95.00.


