
Bitcoin continues to break new all time highs for 2019 day after day, currently trading at $5,929 and inching closer to the $6,000 resistance level. As discussed in our previous Bitcoin price analysis article, BTC/USD is starting to follow the same pattern as the stock markets which could signal that institutional investors are finally hopping on the crypto band wagon.
If Bitcoin is in fact consolidating it’s movements with the stock market then we are in for a nasty day of trading today. After dropping over 450 points on Sunday and recovering on Monday, Dow is back at it dropping more than 500 points as the China-U.S tension is bringing out the bears. So far, Bitcoin remains relatively stable at the $5,800-$5,900 support levels and is not showing any signs of weaknesses just yet.
To further confirm traders’ speculation that current market movements are about fundamental forces and not random, crypto prime dealer SFOX just released their April Volatility Report in which the SFOX research team stated:
“The fundamentals-driven bullish signals we’ve seen — price momentum, infrastructure development, institutional interest, etc. — have been present for several months. While some may worry about market sentiments such as FOMO overwhelming crypto in the wake of an abrupt and unexpected rally, the data interpreted by our index imply that crypto is continuing on a sustained positive trajectory, independent of more transient surges in market interest.”
At the end of the day, slow and steady wins the race. Personally, I would much rather prefer crypto markets to have a prolonged bullish trend rather than have a quick spike followed by a long bearish downtrend (which is what happened at the end of 2017 and all of 2018).
Bitcoin Price Technical Analysis
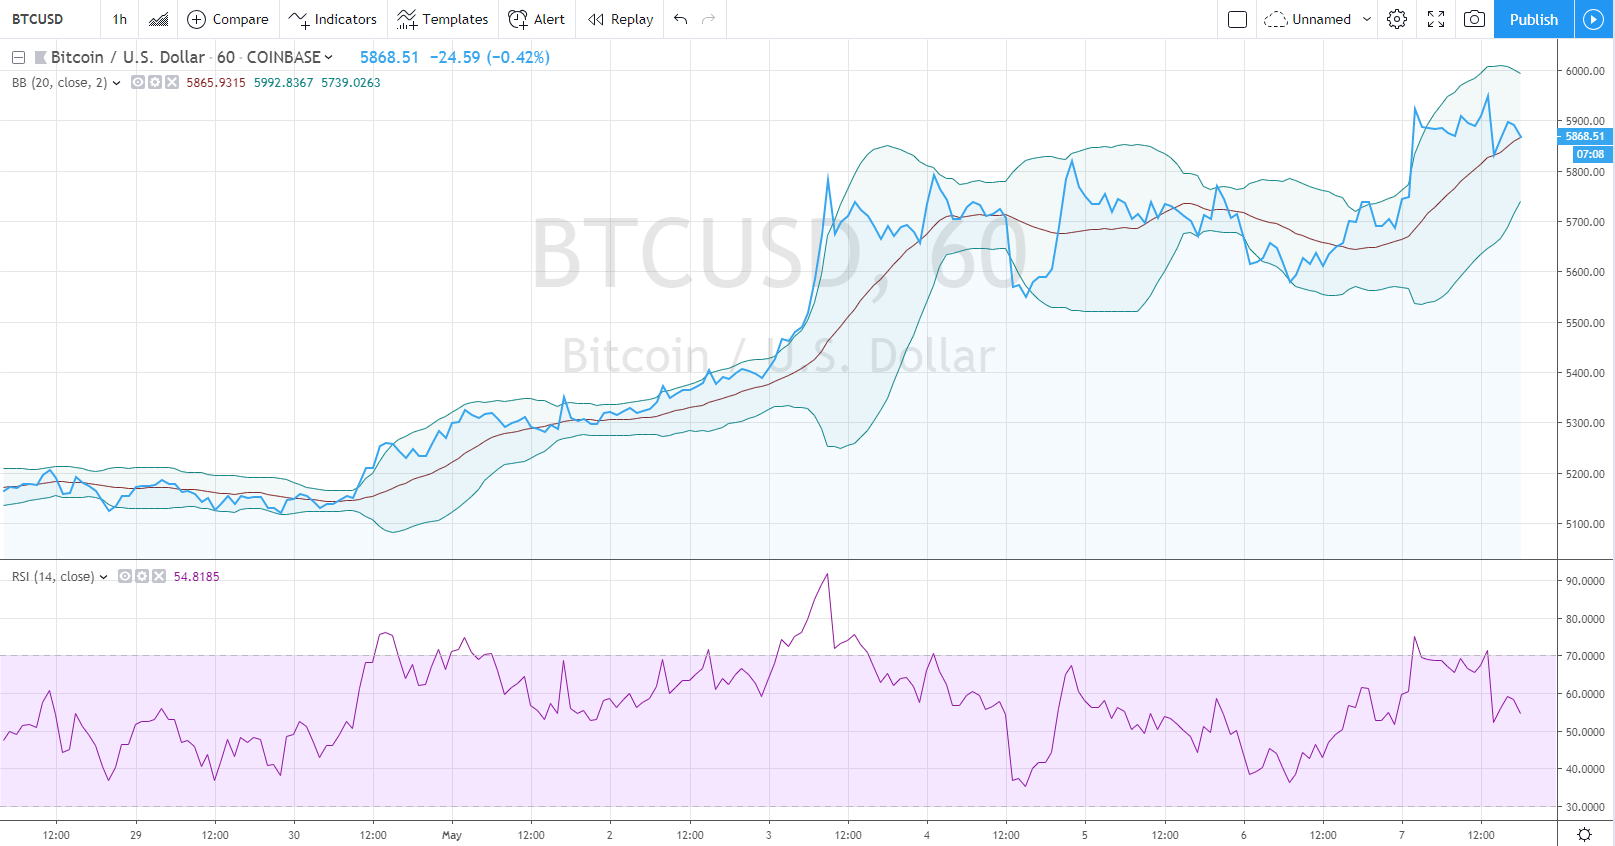
Relative Strength Index: Currently the RSI is at a healthy 54 points meaning the market is neither overbought nor oversold. There is plenty of potential for a move upwards, but there is also an equal potential for a move downward so the current RSI doesn’t tell us much.
Bollinger Bands: The current price of $5,860 is sitting square in the middle of the upper and lower bands and is touching the Moving Average line. The upper band currently sits at $6,000 while the lower band is at $5,735, the price is equally likely to bounce off either levels depending on where the market will take us in the next few hours.
Given the fact that Bitcoin has been recently following the stock market’s movements, and the fact that the Dow fell by over 500 points today, unfortunately a slight pullback is anticipated. However, in the grand scheme of things, a slight retracement shouldn’t throw off the overall bullish momentum of Bitcoin and Crypto markets overall.
Disclaimer: This is not trading or investment advice. The above article is for entertainment and education purposes only. Please do your own research before purchasing or investing into any cryptocurrency.


1 Comment
Wouldnt you agree that the traditional market is never in unison with the crypto market and they are up an down at always opposite times?