 – Bonk Breaks Higher Amidst Latest Market Surge, Returns Over 13000% In a Year")
While most meme coins lag in the ongoing surge, Bonk’s price increased by 50% today as it breaks higher. This puts the asset in the market top-gainer spot with a traded volume of $281 million in the last 24 hours.
Following the January 4 listing on the Bybit exchange, Bonk opened trade at $0.000001 and later rallied by almost 400% to the high of $0.0000049 after 24 hours of launch.
Unfortunately, it rejected that high and dropped for several months.
In mid-October, Bonk bottomed at $0.0000001 and began to show signs of strength. It closed bullish that month and crossed into November with a slight pullback. It bounced back and surged through January high to tap $0.00000576.
After correcting lower for two weeks, the meme coin regained strength and advanced rally with a massive surge in volatility. The ongoing surge flipped last week’s high to mark a new all-time high of $0.0000156 after two months of consistent increase.
Bonk’s trend looks extremely bullish on the current daily chart. More positive actions are expected as long as the demand level keeps rising. A strong bearish interception could trigger a drop. But currently, no sign of bears in the market as the bulls remain in control.
However, it is essential to note that Bonk is the trending dog-themed token today, the first meme coin on the Solana blockchain with a staggering 700% gain in a month. As per CoinmarketCap metrics, it is currently the third-largest meme coin with a market cap of $900 million.
BONK’s Key Level To Watch
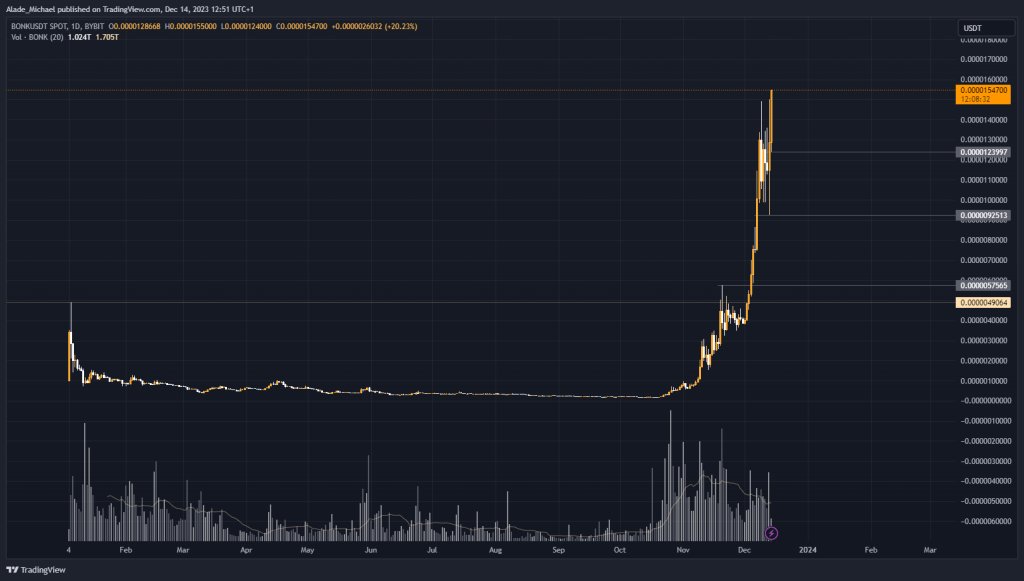
Source: TradingView
The price is currently charging towards the $0.000016 range. A surge above that range could allow the price to reach $0.000018 and $0.000020 – all serving as potential resistance levels for a test.
While today’s low of $0.0000124 serves as close support, a drop below it could pull the price to a psychological level of $0.00001, followed by $0.00000925 (weekly low). The support level to watch for a deep pullback lies at $0.00000575.
Key Resistance Levels: $0.000016, $0.000018, $0.000020
Key Support Levels: $0.0000124, $0.00000925, $0.00000575
- Spot Price: $0.0000154
- Trend: Bullish
- Volatility: High
Disclosure: This is not trading or investment advice. Always do your research before buying any cryptocurrency or investing in any services.
Follow us on Twitter @nulltxnews to stay updated with the latest Crypto, NFT, AI, Cybersecurity, Distributed Computing, and Metaverse news!
Image Source: zieproject/123RF // Image Effects by Colorcinch


