
After hitting a one year low earlier last week, the Ethereum price has been struggling to stay above the $200 level. At the time of writing ETH is trading at $196, down over 10% in the past 24 hours. What is going on? What does the future hold for Ethereum? This article will attempt to answer these questions.
What is going on with the Ethereum price?
Other than the obvious factors such as the whole cryptocurrency market falling along with Bitcoin, thus dragging the Ethereum price down. There are rumors floating around that ICOs are liquidating their ETH holdings to recover some value. In the month of September alone, ICOs only raised roughly $21 million, which is nothing compared to the hundreds of millions that was being raised last year.
Because the cryptocurrency market isn’t doing great overall, ICOs can not longer sell their own tokens to fund their projects. As a result, they have to resort to selling their ETH holdings. This causes enormous selling pressure on Ethereum which is part of the reason it is having a hard time.
What does the future hold for Ethereum?
Looking at some technical indicators, PureStructureNoBS from tradingview highlights a few head and shoulders patterns which are signalling that more bearish action is ahead:
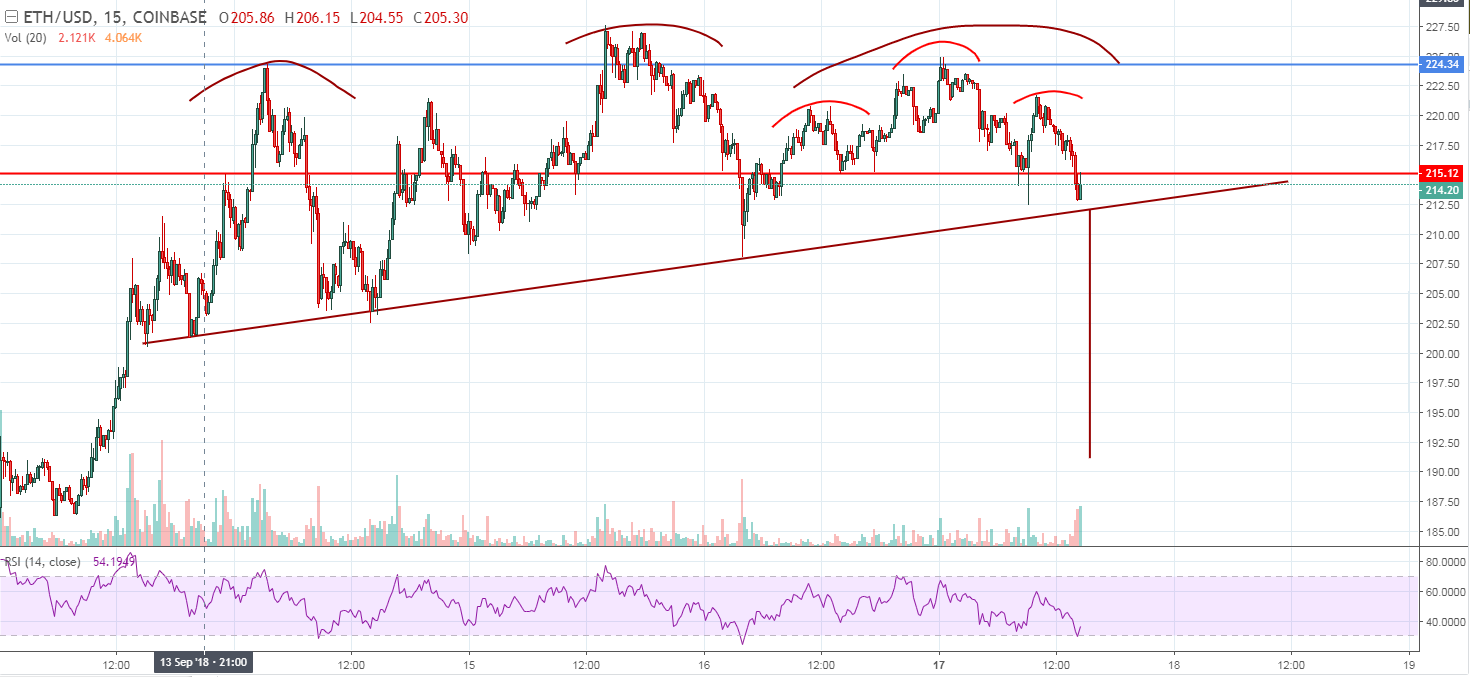
Chart: Tradingview
He said:
“I see two (2) Head and Shoulder formations in ETH. The darker red is the bigger H&S with a target around 190s. BTC is also breaking down at this time. If BTC breaks the big bear flag straight from here then we will have a huge sell off with ETH having the best profit potential of the 2. Though we are likely to see some kind of bounce before breaking the bear flag in BTC”
Keep in mind that technical indicators are all about perspective. Another user by the name of musdy from tradingview shared a chart where you can see a reverse H&S pattern, signalling that a bullish push might be looming ahead:
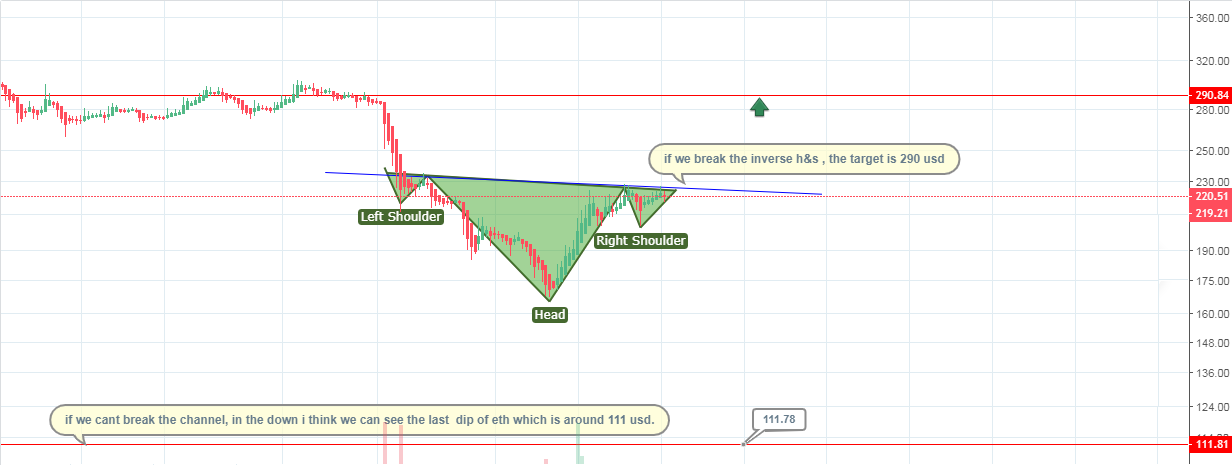
Chart: Tradingview
In short, his chart shows that if the inverse H&S completes and causes a breakout, we can see prices as high as $290. On the other hand if “we can’t break the channel in the down, [I] think we can see the last dip of eth which is around $111.78” –musdy
While it is important to look at technical indicators, you also have to look at the overall trend of the market – where is it heading? Unfortunately, both the Ethereum and cryptocurrency markets are bearish. As such, the most likely scenario is that ETH will face more dips in the coming future.
What I’m personally hoping for, is for the Ethereum price to at least maintain the $200 level. That is a round and an emotional number which traders are going to use in the short term to judge whether ETH has a chance at rebuttal. Also, I would keep a close eye on Bitcoin and the cryptocurrency’s market cap overall for signs of life. That includes either prolonged sideways trading or bullish waves that are actually sustained.
What do you think is Ethereum’s prognosis? Will the currency experience new lows or will it recover? Let us know in the comments section below!
Ethereum Charts by Tradingview
Image(s): Shutterstock.com


