
These are good times to be an active cryptocurrency trader. Even with the barest of knowledge, anyone can get a feel for how the markets are currently evolving and where things may head next. The recent XRP price momentum certainly took people by surprise, although the excitement might not necessarily be over just yet.
Contents
XRP Follows the Overall Trend
It is always difficult to pinpoint an exact reason as to why the value of any currency, token, or asset is moving up. Over the years, it has become apparent most markets follow Bitcoin’s overall trend in one way or another. When the world’s leading cryptocurrency continues to rise in value, there is a good chance all other markets will follow a very similar path.
While most people would like to point at Ripple’s developments behind the scenes, it would appear that has little to do with this current price increase. It is good to see the parent company continue to forge ahead with its plans to revitalize the financial industry. However, that has very little to no impact on XRP’s price directly. More specifically, it won’t affect the public price of XRP, as Ripple’s partners are not buying this asset from places like Binance, Coinbase, or Poloniex.
XRP/USD Technical Analysis
On to the good stuff for today. For this chart, we are looking at the XRP/USD ratio on Bitstamp, which tells a rather interesting tale. All of the indicators on this Tradingview chart are free to use and will not require a paid subscription to plot. At the bottom of the chart, we have the MACD indicator with standard settings. On the price part, there are Bollinger Bands with standard settings, as well as the RSI Strategy indicator with its default settings. This latter indicator is a personal preference and can be substituted for any other of one’s choosing.
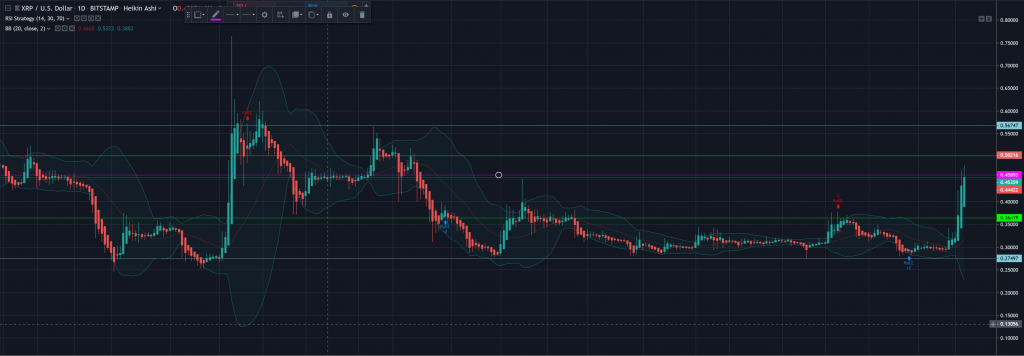
By drawing basic support and resistance levels, we can see the XRP price has successfully bounced twice from its support level at $0.27497 in recent months. Financial markets have a long history in terms of revisiting old levels, which is exactly what happened in recent weeks. That level originally came into play for the last time in mid-September of 2018. Keeping a perspective on things is always crucial.
As of right now, there was some initial resistance at $0.36419, which acted as a support level in October of 2018. XRP blazed past that level with ease and is now attempting to break a “perceived’ resistance level at $0.45893. This is not necessarily an actual resistance level, but it is not a previous support value either. It is a point to which the value is drawn quite regularly. Breaking it successfully can yield a potential push to $0.50216, or in the best case, to as high as $0.56747. All of this will hinge on how bullish Bitcoin continues to be, as that remains a big unknown factor.
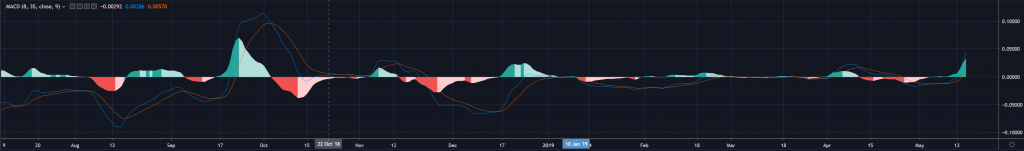
Based on the MACD indicator, it would seem another uptrend is forming. After spending a bit of time in the “oversold” part of the indicator, a very strong bounce has materialized which pushed the price higher as a result. This move seems more convincing than previous upward crosses, as those were all short-lived or potentially fake breakout signals. The last time an upward push of this magnitude took shape was in September 2018 when the value surged to $0.56747 in a few weeks. History could be repeating itself, but the value may continue to ping-pong between $0.45893 and $0.36419 if a successful break doesn’t materialize.
XRP/BTC Technical Analysis
Things look somewhat similar over in the XRP/BTC department. While some may think that is automatically a given, the USD and BTC value of a market don’t always move at the same time, especially not in the cryptocurrency world. We use the exact same free MACD, RSI Strategy, and Bollinger Bands indicators on Tradingview for this daily chart, which also uses Bitstamp as its exchange.
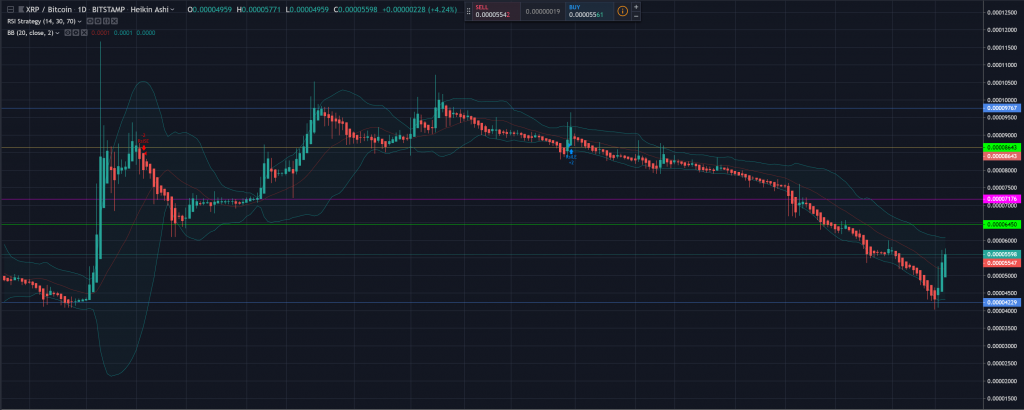
XRP’s BTC value also received a much-needed bounce at the 0.00004229 BTC level. Similar to the USD chart, this BTC level came into play in September of 2018. Ever since the price bounced from that point, it reached a high of just under 9,000 Satoshi. This time around, it remains to be seen if things will ever get to such a level again. A lot of damage has been done in recent months, and the path to recovery is never an easy one.
So far, a few interesting price level can be identified. With a successful bounce off the 0.00004229 BTC level, a push to 0.00006450 seems somewhat plausible at this point. This particular level has acted as support during the previous uptrend, but later turned into a resistance level when the price broke through it rather quickly. Overcoming this hurdle may prove an interesting challenge. The second key level is situated near 0.00007176 BTC, which has acted as both supported and resistance in the past. Under the current circumstances, it is still a resistance level to overcome. Looking beyond that point won’t serve any real purpose, but the 0.00008643 BTC and 0.00009769 BTC levels are other key zones to keep an eye on in the future.
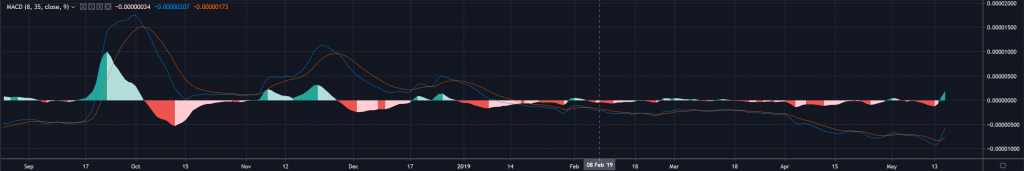
The MACD Indicator for XRP/BTC also shows a healthy desire to turn bullish in the coming days, assuming Bitcoin’s trend doesn’t fall apart. The market is in rather oversold territory for quite some time now and is showing signs of reversing course. This current uptrend is not an official confirmation yet, but it looks as if things could start to improve. Right now, it seems the uptrend will remain in place for another day, although one never knows what the next few hours may bring.
Special Mention: The Elder Ray Indicator
Not too many cryptocurrency traders are familiar with the Elder Ray Indicator. It is by no means a requirement to determine the future XRP price or value of any other financial instrument. However, it is an “extra tool” to see how the comparison of bulls versus bears looks in the market at any given time. Over at Trading212, one can apply the Elder Ray Indicator to a handful of cryptocurrency charts, including the XRP one. Traders can never use enough indicators to seek confirmation of a current market trend.
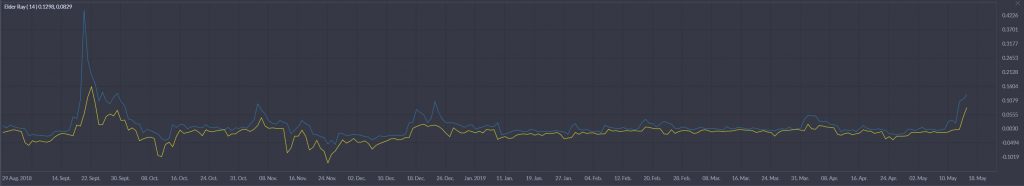
When looking at this indicator, the blue line indicates the “bull power”, whereas the yellow line represents the “bear power”. Both of these values are often close together. At this time, both lines are moving up, which shows the market is in a healthy state. This is not a pump by a few traders, as there are plenty of people performing “bearish” actions to keep the overall growth in check. One can interpret this signal as an extra validation of how the uptrend can remain in place for at least another day. However, this situation can always change in volatile markets.
Disclaimer: This is not trading or investment advice. The above article is for entertainment and education purposes only. Please do your own research before purchasing or investing into any cryptocurrency.
Image(s): Shutterstock.com